You can not select more than 25 topics
Topics must start with a chinese character,a letter or number, can include dashes ('-') and can be up to 35 characters long.
15 KiB
15 KiB
【高并发】一文搞懂线程与多线程
大家好,我是冰河~~
工作多年后,小伙伴们是否曾静下心来思考到底什么是线程?到底什么是多线程?今天冰河就带你一探究竟!!
一、线程与多线程
1.线程
在操作系统中,线程是比进程更小的能够独立运行的基本单位。同时,它也是CPU调度的基本单位。线程本身基本上不拥有系统资源,只是拥有一些在运行时需要用到的系统资源,例如程序计数器,寄存器和栈等。一个进程中的所有线程可以共享进程中的所有资源。
2.多线程
多线程可以理解为在同一个程序中能够同时运行多个不同的线程来执行不同的任务,这些线程可以同时利用CPU的多个核心运行。多线程编程能够最大限度的利用CPU的资源。如果某一个线程的处理不需要占用CPU资源时(例如IO线程),可以使当前线程让出CPU资源来让其他线程能够获取到CPU资源,进而能够执行其他线程对应的任务,达到最大化利用CPU资源的目的。
二、实现线程的方式
在Java中,实现线程的方式大体上分为三种,通过继承Thread类、实现Runnable接口,实现Callable接口。简单的示例代码分别如下所示。
- 继承Thread类代码
package io.binghe.concurrent.executor.test;

/**
 * @author binghe
 * @version 1.0.0
 * @description 继承Thread实现线程
 */
public class ThreadTest extends Thread {
    @Override
    public void run() {
        //TODO 在此写在线程中执行的业务逻辑
    }
}
- 实现Runnable接口代码
package io.binghe.concurrent.executor.test;

/**
 * @author binghe
 * @version 1.0.0
 * @description 实现Runnable实现线程
 */
public class RunnableTest implements Runnable {
    @Override
    public void run() {
        //TODO 在此写在线程中执行的业务逻辑
    }
}
- 实现Callable接口代码
package io.binghe.concurrent.executor.test;

import java.util.concurrent.Callable;

/**
 * @author binghe
 * @version 1.0.0
 * @description 实现Callable实现线程
 */
public class CallableTest implements Callable<String> {
    @Override
    public String call() throws Exception {
        //TODO 在此写在线程中执行的业务逻辑
        return null;
    }
}
三、线程的生命周期
1.生命周期
一个线程从创建,到最终的消亡,需要经历多种不同的状态,而这些不同的线程状态,由始至终也构成了线程生命周期的不同阶段。线程的生命周期可以总结为下图。
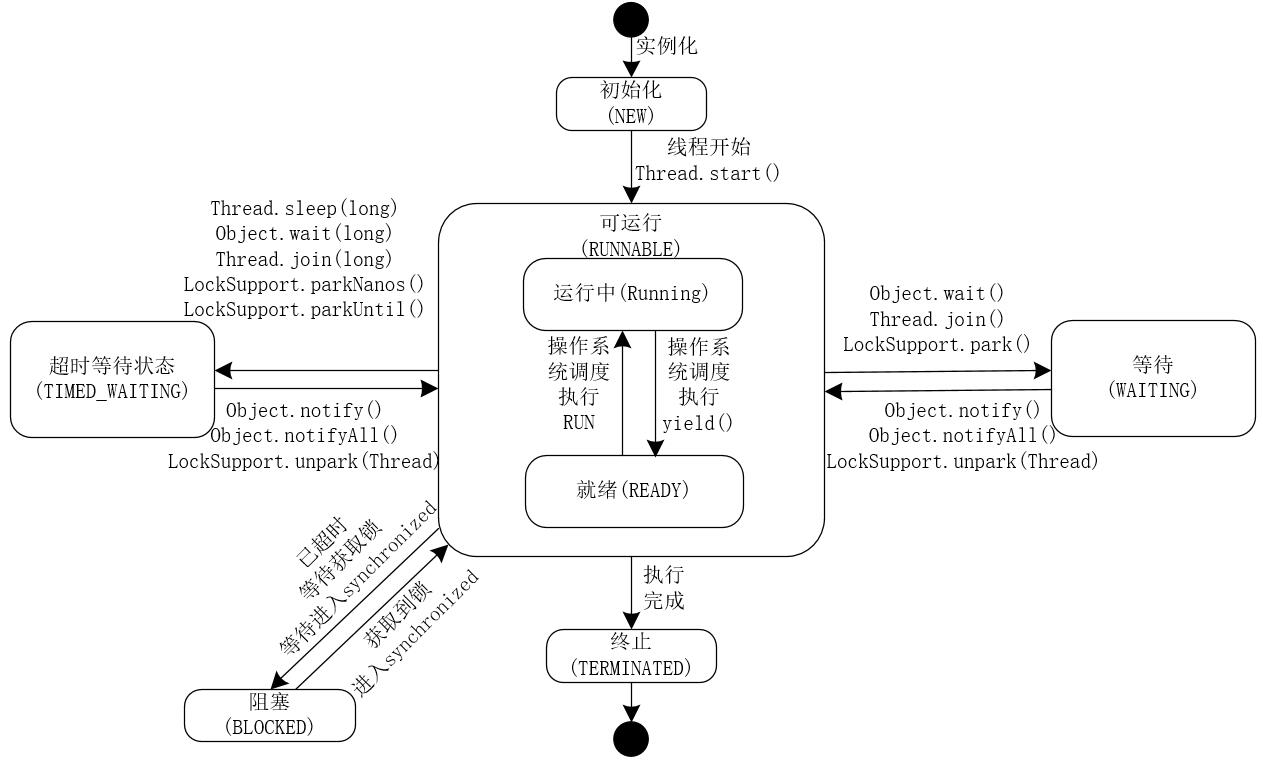
其中,几个重要的状态如下所示。
- NEW:初始状态,线程被构建,但是还没有调用start()方法。
- RUNNABLE:可运行状态,可运行状态可以包括:运行中状态和就绪状态。
- BLOCKED:阻塞状态,处于这个状态的线程需要等待其他线程释放锁或者等待进入synchronized。
- WAITING:表示等待状态,处于该状态的线程需要等待其他线程对其进行通知或中断等操作,进而进入下一个状态。
- TIME_WAITING:超时等待状态。可以在一定的时间自行返回。
- TERMINATED:终止状态,当前线程执行完毕。
2.代码示例
为了更好的理解线程的生命周期,以及生命周期中的各个状态,接下来使用代码示例来输出线程的每个状态信息。
- WaitingTime
创建WaitingTime类,在while(true)循环中调用TimeUnit.SECONDS.sleep(long)方法来验证线程的TIMED_WARTING状态,代码如下所示。
package io.binghe.concurrent.executor.state;

import java.util.concurrent.TimeUnit;

/**
 * @author binghe
 * @version 1.0.0
 * @description 线程不断休眠
 */
public class WaitingTime implements Runnable{
    @Override
    public void run() {
        while (true){
            waitSecond(200);
        }
    }

    //线程等待多少秒
    public static final void waitSecond(long seconds){
        try {
            TimeUnit.SECONDS.sleep(seconds);
        } catch (InterruptedException e) {
            e.printStackTrace();
        }
    }
}
- WaitingState
创建WaitingState类,此线程会在一个while(true)循环中,获取当前类Class对象的synchronized锁,也就是说,这个类无论创建多少个实例,synchronized锁都是同一个,并且线程会处于等待状态。接下来,在synchronized中使用当前类的Class对象的wait()方法,来验证线程的WAITING状态,代码如下所示。
package io.binghe.concurrent.executor.state;

/**
 * @author binghe
 * @version 1.0.0
 * @description 线程在Warting上等待
 */
public class WaitingState implements Runnable {
    @Override
    public void run() {
        while (true){
            synchronized (WaitingState.class){
                try {
                    WaitingState.class.wait();
                } catch (InterruptedException e) {
                    e.printStackTrace();
                }
            }
        }
    }
}
- BlockedThread
BlockedThread主要是在synchronized代码块中的while(true)循环中调用TimeUnit.SECONDS.sleep(long)方法来验证线程的BLOCKED状态。当启动两个BlockedThread线程时,首先启动的线程会处于TIMED_WAITING状态,后启动的线程会处于BLOCKED状态。代码如下所示。
package io.binghe.concurrent.executor.state;

/**
 * @author binghe
 * @version 1.0.0
 * @description 加锁后不再释放锁
 */
public class BlockedThread implements Runnable {
    @Override
    public void run() {
        synchronized (BlockedThread.class){
            while (true){
                WaitingTime.waitSecond(100);
            }
        }
    }
}
- ThreadState
启动各个线程,验证各个线程输出的状态,代码如下所示。
package io.binghe.concurrent.executor.state;

/**
 * @author binghe
 * @version 1.0.0
 * @description 线程的各种状态,测试线程的生命周期
 */
public class ThreadState {

    public static void main(String[] args){
        new Thread(new WaitingTime(), "WaitingTimeThread").start();
        new Thread(new WaitingState(), "WaitingStateThread").start();

        //BlockedThread-01线程会抢到锁,BlockedThread-02线程会阻塞
        new Thread(new BlockedThread(), "BlockedThread-01").start();
        new Thread(new BlockedThread(), "BlockedThread-02").start();
    }
}
运行ThreadState类,如下所示。

可以看到,未输出任何结果信息。可以在命令行输入“jps”命令来查看运行的Java进程。
c:\>jps
21584 Jps
17828 KotlinCompileDaemon
12284 Launcher
24572
28492 ThreadState
可以看到ThreadSate进程的进程号为28492,接下来,输入“jstack 28492”来查看ThreadSate进程栈的信息,如下所示。
c:\>jstack 28492
2020-02-15 00:27:08
Full thread dump Java HotSpot(TM) 64-Bit Server VM (25.202-b08 mixed mode):

"DestroyJavaVM" #16 prio=5 os_prio=0 tid=0x000000001ca05000 nid=0x1a4 waiting on condition [0x0000000000000000]
   java.lang.Thread.State: RUNNABLE

"BlockedThread-02" #15 prio=5 os_prio=0 tid=0x000000001ca04800 nid=0x6eb0 waiting for monitor entry [0x000000001da4f000]
   java.lang.Thread.State: BLOCKED (on object monitor)
        at io.binghe.concurrent.executor.state.BlockedThread.run(BlockedThread.java:28)
        - waiting to lock <0x0000000780a7e4e8> (a java.lang.Class for io.binghe.concurrent.executor.state.BlockedThread)
        at java.lang.Thread.run(Thread.java:748)

"BlockedThread-01" #14 prio=5 os_prio=0 tid=0x000000001ca01800 nid=0x6e28 waiting on condition [0x000000001d94f000]
   java.lang.Thread.State: TIMED_WAITING (sleeping)
        at java.lang.Thread.sleep(Native Method)
        at java.lang.Thread.sleep(Thread.java:340)
        at java.util.concurrent.TimeUnit.sleep(TimeUnit.java:386)
        at io.binghe.concurrent.executor.state.WaitingTime.waitSecond(WaitingTime.java:36)
        at io.binghe.concurrent.executor.state.BlockedThread.run(BlockedThread.java:28)
        - locked <0x0000000780a7e4e8> (a java.lang.Class for io.binghe.concurrent.executor.state.BlockedThread)
        at java.lang.Thread.run(Thread.java:748)

"WaitingStateThread" #13 prio=5 os_prio=0 tid=0x000000001ca06000 nid=0x6fe4 in Object.wait() [0x000000001d84f000]
   java.lang.Thread.State: WAITING (on object monitor)
        at java.lang.Object.wait(Native Method)
        - waiting on <0x0000000780a7b488> (a java.lang.Class for io.binghe.concurrent.executor.state.WaitingState)
        at java.lang.Object.wait(Object.java:502)
        at io.binghe.concurrent.executor.state.WaitingState.run(WaitingState.java:29)
        - locked <0x0000000780a7b488> (a java.lang.Class for io.binghe.concurrent.executor.state.WaitingState)
        at java.lang.Thread.run(Thread.java:748)

"WaitingTimeThread" #12 prio=5 os_prio=0 tid=0x000000001c9f8800 nid=0x3858 waiting on condition [0x000000001d74f000]
   java.lang.Thread.State: TIMED_WAITING (sleeping)
        at java.lang.Thread.sleep(Native Method)
        at java.lang.Thread.sleep(Thread.java:340)
        at java.util.concurrent.TimeUnit.sleep(TimeUnit.java:386)
        at io.binghe.concurrent.executor.state.WaitingTime.waitSecond(WaitingTime.java:36)
        at io.binghe.concurrent.executor.state.WaitingTime.run(WaitingTime.java:29)
        at java.lang.Thread.run(Thread.java:748)

"Service Thread" #11 daemon prio=9 os_prio=0 tid=0x000000001c935000 nid=0x6864 runnable [0x0000000000000000]
   java.lang.Thread.State: RUNNABLE

"C1 CompilerThread3" #10 daemon prio=9 os_prio=2 tid=0x000000001c88c800 nid=0x6a28 waiting on condition [0x0000000000000000]
   java.lang.Thread.State: RUNNABLE

"C2 CompilerThread2" #9 daemon prio=9 os_prio=2 tid=0x000000001c880000 nid=0x6498 waiting on condition [0x0000000000000000]
   java.lang.Thread.State: RUNNABLE

"C2 CompilerThread1" #8 daemon prio=9 os_prio=2 tid=0x000000001c87c000 nid=0x693c waiting on condition [0x0000000000000000]
   java.lang.Thread.State: RUNNABLE

"C2 CompilerThread0" #7 daemon prio=9 os_prio=2 tid=0x000000001c87b800 nid=0x5d00 waiting on condition [0x0000000000000000]
   java.lang.Thread.State: RUNNABLE

"Monitor Ctrl-Break" #6 daemon prio=5 os_prio=0 tid=0x000000001c862000 nid=0x6034 runnable [0x000000001d04e000]
   java.lang.Thread.State: RUNNABLE
        at java.net.SocketInputStream.socketRead0(Native Method)
        at java.net.SocketInputStream.socketRead(SocketInputStream.java:116)
        at java.net.SocketInputStream.read(SocketInputStream.java:171)
        at java.net.SocketInputStream.read(SocketInputStream.java:141)
        at sun.nio.cs.StreamDecoder.readBytes(StreamDecoder.java:284)
        at sun.nio.cs.StreamDecoder.implRead(StreamDecoder.java:326)
        at sun.nio.cs.StreamDecoder.read(StreamDecoder.java:178)
        - locked <0x0000000780b2fd88> (a java.io.InputStreamReader)
        at java.io.InputStreamReader.read(InputStreamReader.java:184)
        at java.io.BufferedReader.fill(BufferedReader.java:161)
        at java.io.BufferedReader.readLine(BufferedReader.java:324)
        - locked <0x0000000780b2fd88> (a java.io.InputStreamReader)
        at java.io.BufferedReader.readLine(BufferedReader.java:389)
        at com.intellij.rt.execution.application.AppMainV2$1.run(AppMainV2.java:64)

"Attach Listener" #5 daemon prio=5 os_prio=2 tid=0x000000001c788800 nid=0x6794 waiting on condition [0x0000000000000000]
   java.lang.Thread.State: RUNNABLE

"Signal Dispatcher" #4 daemon prio=9 os_prio=2 tid=0x000000001c7e3800 nid=0x3354 runnable [0x0000000000000000]
   java.lang.Thread.State: RUNNABLE

"Finalizer" #3 daemon prio=8 os_prio=1 tid=0x000000001c771000 nid=0x6968 in Object.wait() [0x000000001cd4f000]
   java.lang.Thread.State: WAITING (on object monitor)
        at java.lang.Object.wait(Native Method)
        - waiting on <0x0000000780908ed0> (a java.lang.ref.ReferenceQueue$Lock)
        at java.lang.ref.ReferenceQueue.remove(ReferenceQueue.java:144)
        - locked <0x0000000780908ed0> (a java.lang.ref.ReferenceQueue$Lock)
        at java.lang.ref.ReferenceQueue.remove(ReferenceQueue.java:165)
        at java.lang.ref.Finalizer$FinalizerThread.run(Finalizer.java:216)

"Reference Handler" #2 daemon prio=10 os_prio=2 tid=0x000000001c770800 nid=0x6590 in Object.wait() [0x000000001cc4f000]
   java.lang.Thread.State: WAITING (on object monitor)
        at java.lang.Object.wait(Native Method)
        - waiting on <0x0000000780906bf8> (a java.lang.ref.Reference$Lock)
        at java.lang.Object.wait(Object.java:502)
        at java.lang.ref.Reference.tryHandlePending(Reference.java:191)
        - locked <0x0000000780906bf8> (a java.lang.ref.Reference$Lock)
        at java.lang.ref.Reference$ReferenceHandler.run(Reference.java:153)

"VM Thread" os_prio=2 tid=0x000000001a979800 nid=0x5c2c runnable

"GC task thread#0 (ParallelGC)" os_prio=0 tid=0x00000000033b9000 nid=0x4dc0 runnable

"GC task thread#1 (ParallelGC)" os_prio=0 tid=0x00000000033ba800 nid=0x6690 runnable

"GC task thread#2 (ParallelGC)" os_prio=0 tid=0x00000000033bc000 nid=0x30b0 runnable

"GC task thread#3 (ParallelGC)" os_prio=0 tid=0x00000000033be800 nid=0x6f68 runnable

"GC task thread#4 (ParallelGC)" os_prio=0 tid=0x00000000033c1000 nid=0x6478 runnable

"GC task thread#5 (ParallelGC)" os_prio=0 tid=0x00000000033c2000 nid=0x4fe4 runnable

"GC task thread#6 (ParallelGC)" os_prio=0 tid=0x00000000033c5000 nid=0x584 runnable

"GC task thread#7 (ParallelGC)" os_prio=0 tid=0x00000000033c6800 nid=0x6988 runnable

"VM Periodic Task Thread" os_prio=2 tid=0x000000001c959800 nid=0x645c waiting on condition

JNI global references: 12
由以上输出的信息可以看出:名称为WaitingTimeThread的线程处于TIMED_WAITING状态;名称为WaitingStateThread的线程处于WAITING状态;名称为BlockedThread-01的线程处于TIMED_WAITING状态;名称为BlockedThread-02的线程处于BLOCKED状态。
注意:使用jps结合jstack命令可以分析线上生产环境的Java进程的异常信息。
也可以直接点击IDEA下图所示的图表直接打印出线程的堆栈信息。

输出的结果信息与使用“jstack 进程号”命令输出的信息基本一致。
写在最后
如果觉得文章对你有点帮助,请微信搜索并关注「 冰河技术 」微信公众号,跟冰河学习高并发编程技术。
最后,附上并发编程需要掌握的核心技能知识图,祝大家在学习并发编程时,少走弯路。

如果你觉得冰河写的还不错,请微信搜索并关注「 冰河技术 」微信公众号,跟冰河学习高并发、分布式、微服务、大数据、互联网和云原生技术,「 冰河技术 」微信公众号更新了大量技术专题,每一篇技术文章干货满满!不少读者已经通过阅读「 冰河技术 」微信公众号文章,吊打面试官,成功跳槽到大厂;也有不少读者实现了技术上的飞跃,成为公司的技术骨干!如果你也想像他们一样提升自己的能力,实现技术能力的飞跃,进大厂,升职加薪,那就关注「 冰河技术 」微信公众号吧,每天更新超硬核技术干货,让你对如何提升技术能力不再迷茫!