Are you sure you want to delete this task? Once this task is deleted, it cannot be recovered.
You can not select more than 25 topics
Topics must start with a chinese character,a letter or number, can include dashes ('-') and can be up to 35 characters long.
 WANGW09
4bce58537f
WANGW09
4bce58537f
|
2 years ago | |
|---|---|---|
| .META-INF | 2 years ago | |
| PCL-SZ-volume | 2 years ago | |
| data | 2 years ago | |
| figures | 2 years ago | |
| LRRCA.py | 2 years ago | |
| LRRCA.tar.gz | 2 years ago | |
| README.md | 2 years ago | |
README.md
基于线性回归式区域协同的交通流量预测算法
Linear Regression Regional Collaboration Algorithm for Traffic Flow Prediction
作者
李佳栋
项目简介
1. 功能
将深圳市交通流量数据集划分为训练集和测试集,实现线性回归式区域协同算法。
根据训练集优化算法参数,在测试集上进行预测,并计算MAE误差。
同时实现baseline算法(HA),通过统计和作图对比线性回归式区域协同算法相比HA方法在预测集上MAE的提升
2. 性能
Intel(R) Xeon(R) CPU E5-2650 v4 @ 2.20GHz
70s
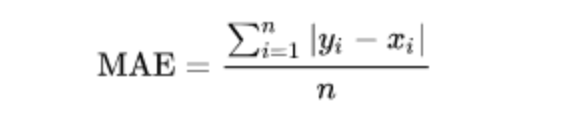
3. 评估指标
MAE(Mean Absolute Error)
计算方法如下
| Model | HA | LRRCA | Improvement |
|---|---|---|---|
| Global MAE | 18.74 | 14.65 | 21.82% |
4. 使用数据集
源数据PCL-SZ-volume是通过处理深圳市交通委的数据得来的自有数据集,数据详情见./PCL-SZ-volume/PCL-SZ-volume.md
运行环境与依赖
代码运行的环境与依赖。如下所示:
| 类别 | 名称 | 版本 |
|---|---|---|
| os | ubuntu | 16.04 |
| numpy | 1.17.4 | |
| pandas | 0.25.3 | |
| matplotlib | 3.3.0 | |
| scikit-learn |
输入与输出
代码的输入与输出。如下所示:
| 名称 | 说明 |
|---|---|
| 输入 | h5格式交通流量数据集,采集点数为25632x136 |
| 输出 | 三个csv文件(真实值,baseline算法预测值,LRRCA算法预测值),小样本真实值和优化前后预测值的数值示例(若debug设为true),小样本真实值和优化前后预测值的曲线对比图(若fig设为true) |
运行方式
在terminal下运行以下命令。
cd project_dir
python LRRCA.py --nid 20501805 --data PCL-SZ-volume/sz_cleaned.h5 --csv_path data --debug --fig
其中data文件夹会存储所有的csv文件,grountruth是真实值,baseline是优化前,LRRCA是线性回归区域协同方法结果。figures会存储可视化结果,名称与方法的对应同上。