Are you sure you want to delete this task? Once this task is deleted, it cannot be recovered.
You can not select more than 25 topics
Topics must start with a chinese character,a letter or number, can include dashes ('-') and can be up to 35 characters long.
 MYD753Q
77a1fc068f
MYD753Q
77a1fc068f
|
1 year ago | |
|---|---|---|
| README.assets | 1 year ago | |
| crowd_vis | 1 year ago | |
| dbmodel | 1 year ago | |
| html | 1 year ago | |
| output | 1 year ago | |
| pp-human | 1 year ago | |
| statics | 1 year ago | |
| README.md | 1 year ago | |
| __init__.py | 1 year ago | |
| db.sqlite3 | 1 year ago | |
| frame1.txt | 1 year ago | |
| manage.py | 1 year ago | |
| records1.txt | 1 year ago | |
| requirements.txt | 1 year ago | |
| test1.mp4 | 1 year ago | |
README.md
基于PP-Human的人流量可视化数据大屏

项目背景
在超大城市的管理中,如何应对人口密度增大所造成的拥挤、踩踏等事故是不可回避的问题。一旦人流密度超过场所所能容纳上限,后续的风险往往难以管控。例如在10月29日的韩国梨泰院发生的踩踏事故共造成156人丧生,造成了不可挽回的损失。本项目旨在对特定区域的人流量进行智慧监控,以辅助管理者在事故发生前及时实施管控,以减少甚至彻底消除大人流量带来的风险。
基于[PP-Human](PaddleDetection/deploy/pipeline at release/2.5 · PaddlePaddle/PaddleDetection (github.com))行人分析工具,我们使用Django+Pyecharts完成动态数据大屏的开发, 完成了人流数据的采集与入库, 打架、摔倒、打电话等事件的警报收集与可视化, 并添加了口罩检测。 对于边缘端的CPU部署性能优化,我们采用Openvino+ONNX的方案,并同时提供各种大小尺寸的模型,以满足不同设备的算力限制。
项目概述
本项目旨在实现对某一特定监控区域进出口人流量的检测与记录,而[PP-Human](PaddleDetection/deploy/pipeline at release/2.5 · PaddlePaddle/PaddleDetection (github.com))为我们提供了全套的解决方案。基于[PP-Human](PaddleDetection/deploy/pipeline at release/2.5 · PaddlePaddle/PaddleDetection (github.com))完善的pipeline,我们使用Django和pyecharts开发了可视化前端;并针对推理速度进行了一定优化,替换了原有的PaddleInference推理方式,使用Openvino以提高pipeine在CPU上的运行速度。
目前已经完成Openvino替换的功能模块有:
| 功能 | 模型 | 替换后fps |
|---|---|---|
| 行人检测与跟踪(640*640) | PP-YOLOe-s | 11.11 |
| 行人检测与跟踪(320*320) | Picodet | 35.02 |
| 行人检测+基于视频分类打架识别 | PP-YOLOe-s + pp-TSM | 10.30 |
| 行人检测+基于图像分类打电话识别 | Picodet + PPHGNet | 7.68 |
*以上均在Intel AiBox(11th Gen Intel(R) Core(TM) i5-1135G7 @ 2.40GHz )上测试所得, 包括所有前后处理流程
**行人检测320输入模型速度提升明显, 但对视野较广的镜头识别效果较差
功能流图
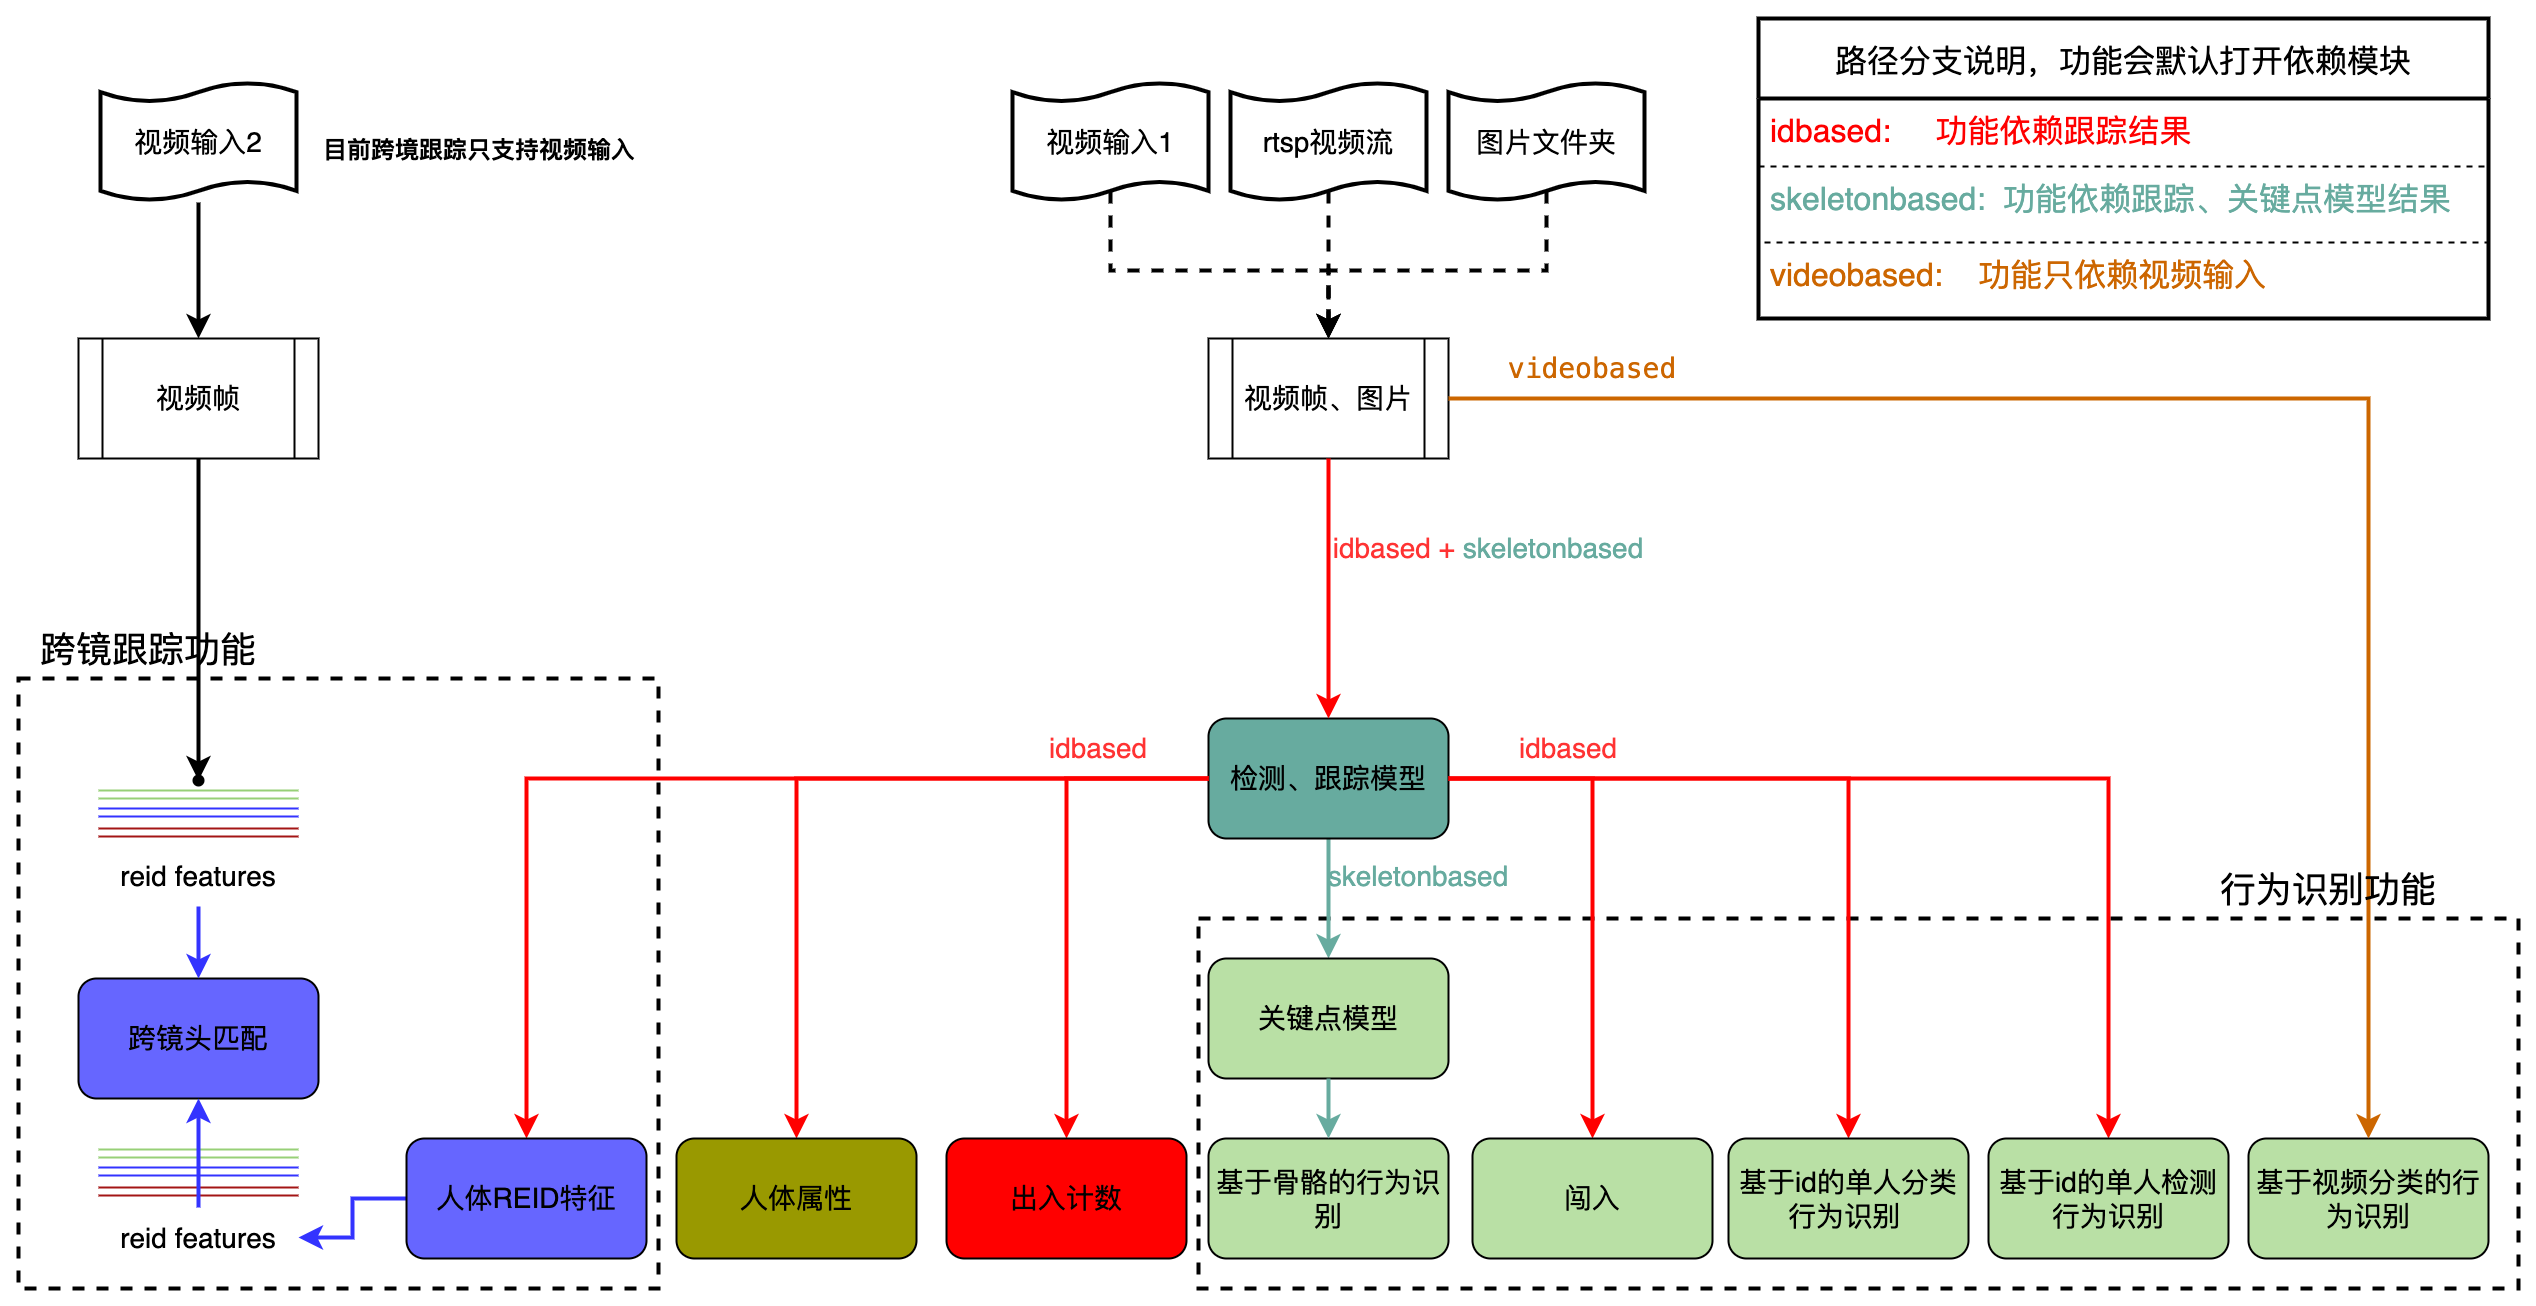
*注:目前的边缘端部署版本不支持rtsp推拉流与跨境跟踪。
主要支持的功能与PP-Human相同:
| 功能 | 方案 | 模型 |
|---|---|---|
| 出入计数,区域闯入识别 | 行人检测与追踪 | PP-YOLOE OC-SORT |
| 行人属性识别 | 单人图像多分类 | PP-HGNet PP-LCNet |
| 打电话 | 单人图像分类行为识别 | PP-HGNet |
| 抽烟 | 单人目标检测行为识别 | PP-YOLOE |
| 打架识别 | 视频分类行为识别 | PP-TSM |
| 摔倒识别 | 骨骼关键点行为识别 | HRNet ST-GCN |
| 口罩识别 | paddlehub | pyramidbox_lite_server_mask |
在数据采集与入库过程中,根据任务性质不同,采用了两种方案:
- 定时采集:对于每个frame推理都会产生的人员计数数据及视频图像等,采用定时采集入库的方式。即定时对实时推理结果进行记录并存入数据库。
- 即时采集:对于偶发的警告事件(如摔倒、打架等),采用即时入库的方式。即一旦检测到事件发生就通过requests将事件发送给后端。
在数据可视化及事件警报的展示上,我们使用Django与Echarts配合完成。使用Django的StreamingHttpResponse实现视频流的传输,并用ajax定时更新网页上的各类图表与警报信息,实现动态数据大屏。
1. 快速开始
1.1 环境配置
整个项目可以在项目挂载的数据集中下载,暂时还没有上传github,下载解压完成后
# 切换到解压目录
cd crowd_vis

# 我已经把依赖全部写在requirements.txt中,直接pip安装即可
# paddlepaddle没有写入,没有安装的话自行安装
pip install -r requirements.txt
1.2 启动服务
命令行运行:
python manage.py runserver
出现以下内容即启动成功
System check identified no issues (0 silenced).
August 19, 2022 - 22:53:05
Django version 3.2.15, using settings 'crowd_vis.settings'
Starting development server at http://127.0.0.1:8000/
Quit the server with CONTROL-C.
随后启动你的浏览器,输入http://127.0.0.1:8000/即可访问
2. 视频流式传输解决方案
PP-Human其实目前并不支持流式传输,我这里用了一个挺憨的办法结合django的StreamingHttpResponse实现了“伪流式”,在前端的网页上确实是流式了(
2.1 PP-Human埋点
在pipeline.py文件中的predict_video函数的末尾加入
show_im = cv2.resize(im, (0, 0), fx=0.5, fy=0.5)
temp1, temp2 = cv2.imencode('.jpeg', show_im)
fp = open('frame.txt', 'wb')
fp.write(temp2.tobytes())
fp.close()
fp = open('records.txt', 'w')
ajax_data = records[-1]
ajax_data = [ajax_data, len(mot_res['boxes'])]
json.dump(ajax_data, fp)
fp.close()
整个PP-Human的pipeline其实就是一连串模型逐一对单个frame推理然后可视化,所以在函数的最后可以直接找到可视化结束的im变量,将他转换tobytes()之后,就可以传递给django处理了
2.2 Django流式传输
Django有StreamingHttpResponse流式响应类,这个类不同于普通的HttpResponse,他需要利用迭代器缓存数据。于是编写django视图读取之前埋点“偷”来的图片数据放入缓存其就实现了“伪”流式(在前端是真流式):以下是views.py中的流式传输部分
def pp_human_service():
    # PP-Human后台进程
    while True:
        pp_human_path = os.path.join(BASE_DIR, "pp-human", "pipeline", "pipeline.py ")
        yml_path = os.path.join(BASE_DIR, "pp-human", "pipeline", "config", "infer_cfg_pphuman.yml ")
        test_video_path = os.path.join(BASE_DIR, 'test1.mp4')
        # shell = r'python ' + pp_human_path + '--config ' + yml_path + r' --camera_id=0 --device=gpu --output_dir=output --do_entrance_counting'
        shell = r'python ' + pp_human_path + '--config ' + yml_path + r' --video_file=' + test_video_path + ' --device=gpu --output_dir=output --do_entrance_counting'
        subprocess.run(shell, stdout=subprocess.DEVNULL, stderr=subprocess.DEVNULL)
        # subprocess.run(shell)


t = threading.Thread(target=pp_human_service)
t.setDaemon(True)
t.start()


def video_display():
    # 流式视频传输迭代器
    txt_path = os.path.join(BASE_DIR, 'frame.txt')
    while True:
        fp = open(txt_path, 'rb')
        info = fp.read()
        fp.close()
        if info:
            yield b'--frame\r\n Content-Type: image/jpeg\r\n\r\n' + info + b'\r\n'


def video(request):
    # 使用流传输传输视频流
    return StreamingHttpResponse(video_display(), content_type='multipart/x-mixed-replace; boundary=frame')
3. 数据入库与数据动态刷新
3.1 数据入库
与前面伪流式的方法差不多,起一个定时的子进程收录从PP-Human埋点中采集的推理结果与信息。直接写在views.py里就可以,django在启动服务的时候会顺路把这些子进程都带起来。
def info_update_service():
    # 数据采集入库后台进程
    global context
    txt_path = os.path.join(BASE_DIR, 'records.txt')
    while True:
        try:
            fp = open(txt_path, 'r')
            info = json.load(fp)
            fp.close()
            vis_count = info[1]
            info = info[0]
            info = info[info.find("Total count: ") + 13:]
            total = eval(info[:info.find(',')])
            info = info[info.find(":") + 2:]
            in_count = eval(info[:info.find(',')])
            info = info[info.find(":") + 2:]
            out_count = eval(info[:-1])
            count0, count1, count2, count3, count4 = total % 10, total // 10 % 10, total // 100 % 10, total // 1000 % 10, total // 10000 % 10
            context = [total, vis_count, in_count, out_count, count0, count1, count2, count3, count4]
            db_obj = crowdinfo(total_count=total, in_count=in_count,
                               out_count=out_count,
                               vis_count=vis_count)
            db_obj.save()
            sleep(2)
        except Exception as e:
            sleep(2)
            print("db saving failed!")
            print(e)
            pass


t1 = threading.Thread(target=info_update_service)
t1.setDaemon(True)
t1.start()
3.2 数据动态实时刷新
数据动态刷新就是ajax的工作了,在django我们只需要写一个返回Json数据的view就可以。
这里使用pyecharts把各种数据表都整好之后一起扔给ajax处理。
def graph_vis(request):
    # 人流折线图,数据表格,饼图数据更新
    x_data = []
    vis_data = []
    in_data = []
    out_data = []
    table_data = []
    pie_data = []
    for info in crowdinfo.objects.all().order_by('-shoot_time')[:20]:
        if not pie_data:
            pie_data = [("滞留量", info.total_count-info.in_count-info.out_count),
                        ("流入量", info.in_count),
                        ("流出量", info.out_count)]
        x_data.append(info.shoot_time.strftime("%Y-%m-%d %H:%M:%S"))
        vis_data.append(info.vis_count)
        in_data.append(info.in_count)
        out_data.append(info.out_count)
        table_data.append([info.shoot_time.strftime("%y-%m-%d %H:%M:%S"), info.total_count, info.vis_count, info.out_count, info.in_count])
    data1 = (
        Line()
        .add_xaxis(x_data)
        .add_yaxis("进入人流", in_data, is_smooth=True, symbol_size=10, is_connect_nones=True, color='red',
                   linestyle_opts=opts.series_options.LineStyleOpts(width=3))
        .add_yaxis("出口人流", out_data, is_smooth=True, symbol_size=10, is_connect_nones=True, color='green',
                   linestyle_opts=opts.series_options.LineStyleOpts(width=3))
        .set_global_opts(legend_opts=opts.LegendOpts(textstyle_opts=opts.TextStyleOpts(color='white')),
                         xaxis_opts=opts.AxisOpts(type_='time',
                                                  axisline_opts=opts.AxisLineOpts(linestyle_opts=opts.LineStyleOpts(
                                                      color='white'))),
                         yaxis_opts=opts.AxisOpts(axisline_opts=opts.AxisLineOpts(linestyle_opts=opts.LineStyleOpts(
                             color="white"))),
                         )
        .dump_options_with_quotes()
    )
    data2 = (
        Line()
        .add_xaxis(x_data)
        .add_yaxis("在镜人流", vis_data, is_smooth=True, symbol_size=10, is_connect_nones=True, color='red',
                   linestyle_opts=opts.series_options.LineStyleOpts(width=3))
        .set_global_opts(legend_opts=opts.LegendOpts(textstyle_opts=opts.TextStyleOpts(color='white')),
                         xaxis_opts=opts.AxisOpts(type_='time',
                                                  axisline_opts=opts.AxisLineOpts(linestyle_opts=opts.LineStyleOpts(
                                                                                            color='white'))),
                         yaxis_opts=opts.AxisOpts(axisline_opts=opts.AxisLineOpts(linestyle_opts=opts.LineStyleOpts(
                                                                                            color="white"))),
                         )
        .dump_options_with_quotes()
    )
    data3 = (
        Table()
        .add(headers=['采集时间', '总人流', '在镜人流', '出口人流', '进口人流'],
             rows=table_data)
        .render('statics/render.html')
    )
    data3 = open('statics/render.html', 'r', encoding='utf-8').read()
    data3 = data3[data3.find("<table"):data3.find("</table>")]
    data3 = data3.replace('\n', '').replace('"', "'")
    data4 = (
        Pie()
        .add('', pie_data, center=['50%', '60%'], radius='70%')
        .set_global_opts(title_opts=opts.TitleOpts(title="人流状态分布",
                                                   title_textstyle_opts=opts.TextStyleOpts(color="white")),
                         legend_opts=opts.LegendOpts(orient='vertical', pos_left='right',
                                                     textstyle_opts=opts.TextStyleOpts(color='white')))
        .set_series_opts(label_opts=opts.LabelOpts(formatter="{b}: {c}"))
        .set_colors(["red", "yellow",  "pink", "orange", "purple"])
        .dump_options_with_quotes()
    )
    data1 = json.loads(data1)
    data2 = json.loads(data2)
    data3 = json.dumps(data3, ensure_ascii=False)
    data3 = data3.replace('"', '')
    data4 = json.loads(data4)
    data = {
        "code": 200,
        "msg": "success",
        "data": [data1, data2, data3, data4]
    }
    return JsonResponse(data)
ecarts是个JS库为什么要用python画好再传过去?因为这样更符合前后端分离的范式(不过是在给不想写Js找理由)。
一共有4个可视化数据表,前端JS代码如下:很短很方便,我不喜欢JS (
var chart1 = echarts.init(document.getElementById('graph1'),'roma');
var chart2 = echarts.init(document.getElementById('graph2'),'roma');
var chart4 = echarts.init(document.getElementById('graph4'),'light');
$(
    function () {
        fetchData(chart1,chart2,chart4);
        setInterval(fetchData,2000);
	}
);

function fetchData() {
    $.ajax({
        type: "get",
        url: "/graph_vis",
        dataType: 'json',
        success: function (result) {
        chart1.setOption(result.data[0]);
        chart2.setOption(result.data[1]);
        document.getElementById('graph3').innerHTML=result.data[2];
        chart4.setOption(result.data[3]);
        }
    });
}
差点忘了,还有一个数字大屏
function num_count(){
        // 朝后端发送ajax请求
            $.ajax({
            // 1.指定朝哪个后端发送ajax请求
            url:'/num_count', //不写就是朝当前地址提交【与form表单的action参数相同】
            // 2.请求方式
            type:'get',  // 不指定默认就是get,都是小写
            // 3.数据
            data:{},
            // 4.回调函数:当后端给你返回结果的时候会自动触发,args接受后端的返回结果
            success:function (args) {
                document.getElementById('count1').innerHTML=args[0];
                document.getElementById('count2').innerHTML=args[1];
                document.getElementById('count3').innerHTML=args[2];
                document.getElementById('count4').innerHTML=args[3];
                document.getElementById('num_count0').innerHTML=args[4];
                document.getElementById('num_count1').innerHTML=args[5];
                document.getElementById('num_count2').innerHTML=args[6];
                document.getElementById('num_count3').innerHTML=args[7];
                document.getElementById('num_count4').innerHTML=args[8];
            }
            })
    }
    setInterval("num_count()",1000);
4. OpenVino推理
所有的OpenVino类都在 crowd_vis\pp-human\openvino_infer 目录下
每个模型大同小异, 确定输入shape后替换openvino推理即可, 此处以图像分类跟踪为例(因为他没啥后处理, 比较简单)
from openvino.inference_engine import IECore
import numpy as np
import pickle

class id_cls_predictor(object):
    def __init__(self, onnxfile):
        # 读取并解析模型
        ie = IECore()
        net = ie.read_network(onnxfile)
        # 原模型为动态图,需要固定模型输入shape
        net.reshape({'x': (1, 3, 224, 224)})
        self.predictor = ie.load_network(net, 'CPU')

    def run(self, inputs):
        outputs = []
        for im in inputs["image"]:
            output = self.predictor.infer({'x': im})
            outputs.append(output['softmax_1.tmp_0'][0])
        outputs = np.array(outputs)
        return {'output': outputs}

# onnxfile = r"C:\Users\SVAI-BOX-I78C\Desktop\project\crowd_vis\pp-human\pipeline\model\onnx_PPHGNet_calling\model.onnx"
# inputs = pickle.load(open("a.pkl", 'rb'))
# print(inputs["image"].shape)
# test = id_cls_predictor(onnxfile)
# output = test.run(inputs)
# print(output,type(output))
5. 未来工作
- 继续完成PP-Human所有模型的openvino推理
- 人流量数据时序相关,考虑接入机器学习的时序模型实现对人流的预警、预测
- 提供更多实用数据分析图表
本项目旨在对特定区域的人流量进行智慧监控,以辅助管理者在事故发生前及时实施管控,以减少甚至彻底消除大人流量带来的风险。使用Django+Pyecharts完成动态数据大屏的开发, 完成了人流数据的采集与入库, 打架、摔倒、打电话等事件的警报收集与可视化, 并添加了口罩检测。
Pickle JavaScript Python SVG Text other
Contributors (3)

